
Manufacturers, cloud kitchens, retail brands, and even software companies face the same core question: with limited capacity, what should we produce or sell more of to maximise profit? The answer is rarely “the top-selling item.” Real profitability depends on contribution margin, resource constraints, demand variability, and strategic priorities such as customer retention or market share. An optimal product mix is the structured approach to selecting the best combination of items to produce so the business earns the highest possible profit while operating within real-world limits. For learners in a business analytics course, product mix decisions are a practical way to connect data, finance, and operations into one analytical problem.
What “Optimal Product Mix” Really Means
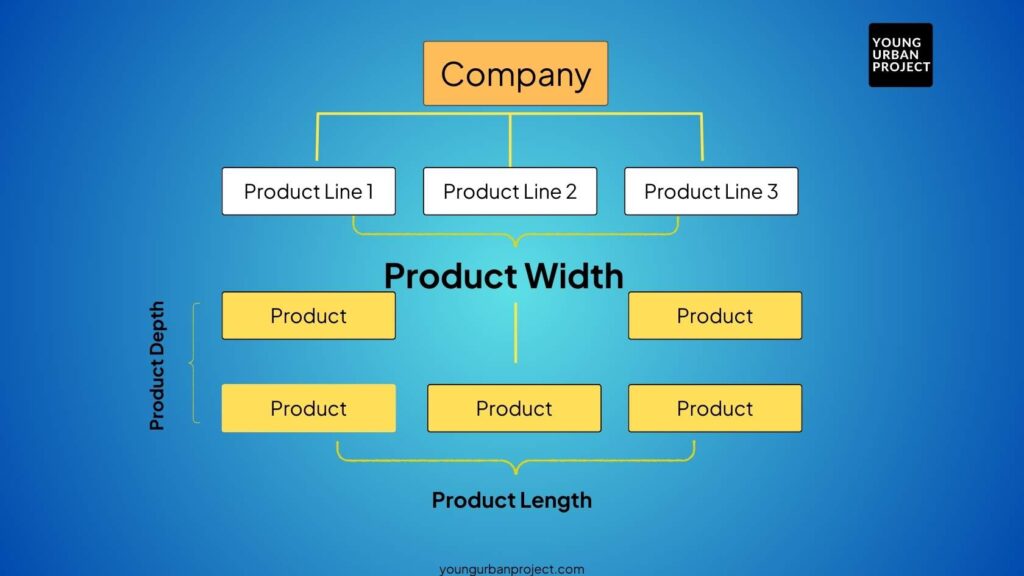
A product mix is the set of products or variants a company produces and the quantities of each. “Optimal” means the mix that produces the best result for a defined objective, usually maximum profit, but sometimes maximum contribution margin, maximum revenue, or minimum cost.
The key point is that the best mix is constrained. Constraints can include:
- Machine hours, labour hours, or line capacity
- Raw material availability
- Storage space and shelf-life
- Budget limits for marketing and distribution
- Minimum order quantities or contractual commitments
When constraints exist, the most profitable decision is often counterintuitive. A high-margin product might still be a poor choice if it consumes scarce resources that could generate more profit elsewhere.
The Building Blocks: Margins, Constraints, and Demand
To calculate an optimal product mix, you need a clean set of inputs. Getting these right is more important than complex modelling.
Contribution Margin, Not Just Gross Profit
Contribution margin tells you how much profit each unit contributes after variable costs are covered. It is typically:
Contribution Margin per Unit = Selling Price – Variable Cost per Unit
Variable cost includes direct materials, direct labour (if variable), packaging, transaction fees, and other costs that increase with each unit. Fixed costs (rent, salaried overhead) are not included because they do not change with short-run production volume.
For product mix decisions, contribution margin helps compare items on a consistent basis.
Identify the True Constraint
Every operation has at least one bottleneck resource that limits output. It could be:
- A specific machine (for example, a CNC machine or baking oven)
- Skilled labour hours
- A critical component that is supply-constrained
If you do not identify the bottleneck, you may optimise the wrong thing. The best mix is usually driven by maximising profit per unit of the constrained resource.
Demand and Practical Limits
Even if a product looks ideal financially, demand matters. Include:
- Maximum forecast demand per period
- Minimum volume commitments (contracts, distribution requirements)
- Service levels (keeping popular SKUs in stock)
This is where analytics becomes a decision tool rather than a spreadsheet exercise.
Approaches to Finding the Optimal Mix
There are two common approaches: a practical heuristic and a formal optimisation model.
Approach 1: Profit per Constrained Resource (Fast and Effective)
If there is one primary constraint, rank products by:
Contribution per Bottleneck Unit = Contribution Margin per Unit / Bottleneck Units Used per Unit
Then allocate capacity starting with the highest ratio until you hit demand limits or the capacity is exhausted.
This method is simple, transparent, and often good enough for many operational decisions.
Approach 2: Linear Programming (Best for Multiple Constraints)
When you have multiple constraints (machine hours, labour hours, material limits), linear programming (LP) is a better fit. LP defines:
- Decision variables (units of each product to produce)
- Objective function (maximise total contribution)
- Constraints (capacity, demand, materials, minimum volumes)
LP can be solved in tools like Excel Solver, Python, or specialised optimisation software. This is a core application area for students pursuing a business analytics course because it demonstrates how analytics directly improves profitability.
Real-World Considerations That Change the “Best” Answer
An optimal product mix is not purely mathematical. These factors frequently shift what is truly optimal:
Product Interdependencies and Bundling
Some products are sold together, or one product drives demand for another. For example, low-margin accessories may boost sales of a high-margin product, or “starter packs” may bring customers into the brand. In these cases, treat the decision at the bundle or portfolio level.
Quality, Yield, and Scrap
If certain products have higher defect rates or more scrap, the true variable cost and capacity usage increase. Include yield assumptions, especially in manufacturing and food operations.
Setup Times and Changeovers
Frequent switching between products can reduce available capacity. If changeovers are significant, include setup time as a capacity constraint or simplify the mix to reduce switching costs.
Strategic and Customer Commitments
Some SKUs must exist for brand credibility or channel partnerships. A strict “profit max” answer may violate long-term strategy. A good product mix model allows minimum volumes for strategic items and optimises around them.
A Practical Step-by-Step Workflow
- List products and define the time period (weekly/monthly).
- Calculate contribution margin per unit using reliable cost inputs.
- Map each product’s resource usage (machine hours, labour, materials).
- Identify constraints and demand limits with operations and sales teams.
- Choose the method: ratio ranking for single constraint, LP for multiple constraints.
- Run scenarios: changes in demand, costs, price, or capacity.
- Review results with stakeholders and validate feasibility on the shop floor.
Conclusion
Optimal product mix is about selecting the most profitable combination of items under real constraints, not simply producing what sells the most. By focusing on contribution margin, bottleneck resources, demand limits, and operational realities like setups and yield, businesses can make smarter production choices with measurable profit impact. Whether you use a quick ranking method or a linear programming model, the goal is the same: turn data into a decision that improves performance. This is exactly the kind of applied problem that helps learners to build job-relevant analytical thinking and decision-making skills.
